 Web Server Statistics for NIC.Funet.fi
 Web Server Statistics for NIC.Funet.fi
(Go To: Top: General Summary: Monthly Report: Daily Summary: Hourly Summary: Domain Report: Organisation Report: Status Code Report: File Size Report: File Type Report: Directory Report: Request Report)
This report contains overall statistics.
Successful requests: 1,148
Average successful requests per day: 191
Distinct files requested: 114
Distinct hosts served: 561
Data transferred: 1.480 gigabytes
Average data transferred per day: 253.749 megabytes
(Go To: Top: General Summary: Monthly Report: Daily Summary: Hourly Summary: Domain Report: Organisation Report: Status Code Report: File Size Report: File Type Report: Directory Report: Request Report)
This report lists the activity in each month.
Each unit ( ) represents 0.08 gigabytes
or part thereof.
   month:  Gbytes: %bytes: reqs:  %reqs:
--------: -------: ------: ----: ------:
Mar 2003:   1.480:   100%: 1148:   100%:
Busiest month: Mar 2003 (1.480 gigabytes).
(Go To: Top: General Summary: Monthly Report: Daily Summary: Hourly Summary: Domain Report: Organisation Report: Status Code Report: File Size Report: File Type Report: Directory Report: Request Report)
This report lists the total activity for each day of the week, summed over all the weeks in the report.
Each unit ( ) represents 15 megabytes
or part thereof.
day: Mbytes: %bytes: reqs: %reqs: ---: -------: ------: ----: ------: Sun: 312.985: 20.64%: 201: 17.51%:Mon: 278.017: 18.33%: 203: 17.68%:
Tue: 266.331: 17.56%: 188: 16.38%:
Wed: 256.996: 16.95%: 188: 16.38%:
Thu: 257.118: 16.96%: 191: 16.64%:
Fri: 144.878: 9.55%: 177: 15.42%:
Sat: 0.000: : 0: :

(Go To: Top: General Summary: Monthly Report: Daily Summary: Hourly Summary: Domain Report: Organisation Report: Status Code Report: File Size Report: File Type Report: Directory Report: Request Report)
This report lists the total activity for each hour of the day, summed over all the days in the report.
Each unit ( ) represents 1 request
for a page.
hour:  Mbytes: %bytes: reqs:  %reqs:
----: -------: ------: ----: ------:
   0:  48.380:  3.19%:   56:  4.88%:
   1:  32.746:  2.16%:   65:  5.66%:
   2:  47.601:  3.14%:   44:  3.83%:
   3:  10.988:  0.72%:   35:  3.05%:
   4:  13.551:  0.89%:   37:  3.22%:
   5:  24.299:  1.60%:   33:  2.87%:
   6:  26.326:  1.74%:   51:  4.44%:
   7:  11.722:  0.77%:   24:  2.09%:
   8:  12.031:  0.79%:   22:  1.92%:
   9:  39.786:  2.62%:   44:  3.83%:
  10:  66.015:  4.35%:   64:  5.57%:
  11:  72.918:  4.81%:   41:  3.57%:
  12:  79.464:  5.24%:   39:  3.40%:
  13:  89.121:  5.88%:   48:  4.18%:
  14: 107.923:  7.12%:   50:  4.36%:
  15:  94.103:  6.21%:   72:  6.27%:
  16: 118.336:  7.80%:   62:  5.40%:
  17: 231.033: 15.24%:   65:  5.66%:
  18:  18.484:  1.22%:   51:  4.44%:
  19:  56.302:  3.71%:   59:  5.14%:
  20: 203.174: 13.40%:   43:  3.75%:
  21:  47.524:  3.13%:   49:  4.27%:
  22:  28.959:  1.91%:   47:  4.09%:
  23:  35.529:  2.34%:   47:  4.09%:
(Go To: Top: General Summary: Monthly Report: Daily Summary: Hourly Summary: Domain Report: Organisation Report: Status Code Report: File Size Report: File Type Report: Directory Report: Request Report)
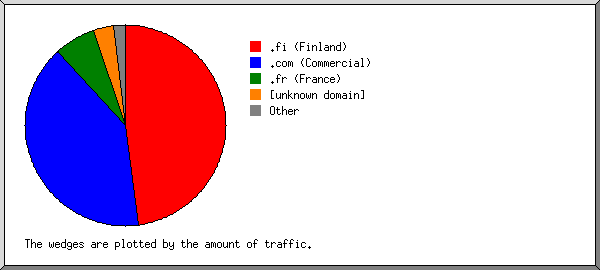
This report lists the countries of the computers which requested files.

Listing domains, sorted by the amount of traffic.
 Mbytes: %bytes: reqs:  %reqs: domain
-------: ------: ----: ------: ------
611.800: 40.35%:   94:  8.19%: .fi (Finland)
315.278: 20.79%:   14:  1.22%:   tpo.fi
 53.983:  3.56%:    6:  0.52%:   htv.fi
 33.016:  2.18%:    5:  0.44%:   sonera.fi
 31.369:  2.07%:   12:  1.05%:   lohjanpuhelin.fi
 31.368:  2.07%:   10:  0.87%:   utu.fi
 31.352:  2.07%:    1:  0.09%:   mil.fi
 31.352:  2.07%:    1:  0.09%:   omakaista.fi
 22.749:  1.50%:    2:  0.17%:   regionline.fi
 22.404:  1.48%:    1:  0.09%:   multi.fi
 16.598:  1.09%:    2:  0.17%:   soon.fi
 12.056:  0.80%:    2:  0.17%:   tut.fi
  7.935:  0.52%:    2:  0.17%:   kolumbus.fi
248.480: 16.39%:  292: 25.44%: [unknown domain]
141.163:  9.31%:   66:  5.75%: .com (Commercial)
 60.386:  3.98%:    4:  0.35%:   datex-ohmeda.com
 54.565:  3.60%:   20:  1.74%:   aol.com
 16.712:  1.10%:    1:  0.09%:   qualcomm.com
128.028:  8.44%:  125: 10.89%: .net (Networks)
 31.352:  2.07%:    1:  0.09%:   suomi.net
 27.906:  1.84%:    1:  0.09%:   edelkey.net
 27.418:  1.81%:   13:  1.13%:   proxad.net
 14.165:  0.93%:    1:  0.09%:   cox.net
 11.804:  0.78%:    5:  0.44%:   t-dialin.net
114.440:  7.55%:   62:  5.40%: .fr (France)
 96.123:  6.34%:   88:  7.67%: .br (Brazil)
 45.684:  3.01%:  112:  9.76%: .ca (Canada)
 20.489:  1.35%:    8:  0.70%: .be (Belgium)
 19.344:  1.28%:   45:  3.92%: .ch (Switzerland)
 15.081:  0.99%:    3:  0.26%: .hk (Hong Kong)
 10.553:  0.70%:   19:  1.66%: .es (Spain)
  8.773:  0.58%:    3:  0.26%: .de (Germany)
  8.757:  0.58%:   36:  3.14%: .mx (Mexico)
  6.682:  0.44%:    5:  0.44%: .pt (Portugal)
  5.039:  0.33%:    3:  0.26%: .mk (Macedonia (Former Yugoslav Republic))
  4.688:  0.31%:    9:  0.78%: .il (Israel)
  4.135:  0.27%:   15:  1.31%: .ar (Argentina)
  3.812:  0.25%:    1:  0.09%: .it (Italy)
  3.773:  0.25%:    4:  0.35%: .nz (New Zealand)
  3.725:  0.25%:   22:  1.92%: .ro (Romania)
  3.135:  0.21%:    5:  0.44%: .ae (United Arab Emirates)
  2.566:  0.17%:   28:  2.44%: .au (Australia)
  1.312:  0.09%:    1:  0.09%: .at (Austria)
  1.208:  0.08%:    4:  0.35%: .ee (Estonia)
  1.168:  0.08%:   20:  1.74%: .uk (United Kingdom)
  0.789:  0.05%:    3:  0.26%: .th (Thailand)
  0.542:  0.04%:    4:  0.35%: .my (Malaysia)
  0.479:  0.03%:    2:  0.17%: .si (Slovenia)
  0.460:  0.03%:    8:  0.70%: .sg (Singapore)
  0.371:  0.02%:    3:  0.26%: .cl (Chile)
  0.368:  0.02%:    6:  0.52%: .id (Indonesia)
  0.359:  0.02%:   11:  0.96%: .dk (Denmark)
  0.330:  0.02%:    4:  0.35%: .tw (Taiwan)
  0.302:  0.02%:    4:  0.35%: .cz (Czech Republic)
  0.291:  0.02%:    3:  0.26%: .ve (Venezuela)
  0.283:  0.02%:    4:  0.35%: .uy (Uruguay)
  0.252:  0.02%:    3:  0.26%: .tr (Turkey)
  0.222:  0.01%:    3:  0.26%: .yu (Yugoslavia)
  0.192:  0.01%:    3:  0.26%: .in (India)
  0.179:  0.01%:    2:  0.17%: .cr (Costa Rica)
  0.179:  0.01%:    2:  0.17%: .lu (Luxembourg)
  0.145:  0.01%:    2:  0.17%: .bg (Bulgaria)
  0.143:  0.01%:    2:  0.17%: .za (South Africa)
  0.133:  0.01%:    3:  0.26%: .pk (Pakistan)
  0.101:  0.01%:    2:  0.17%: .co (Colombia)
  0.101:  0.01%:    1:  0.09%: .mt (Malta)
  0.085:  0.01%:    1:  0.09%: .ph (Philippines)
  0.039:       :    2:  0.17%: .cy (Cyprus)
(Go To: Top: General Summary: Monthly Report: Daily Summary: Hourly Summary: Domain Report: Organisation Report: Status Code Report: File Size Report: File Type Report: Directory Report: Request Report)
This report lists the organisations of the computers which requested files.

Listing the top 20 organisations by the number of requests, sorted by the number of requests.
reqs: %bytes: organisation
----: ------: ------------
 292: 16.39%: [unknown domain]
  53:  1.83%: sympatico.ca
  38:  4.38%: wanadoo.fr
  34:  0.02%: balcab.ch
  26:  0.10%: qc.sympatico.ca
  20:  0.08%: pol.co.uk
  20:  3.60%: aol.com
  19:  1.02%: mc.videotron.ca
  15:  0.46%: ig.com.br
  14: 20.79%: tpo.fi
  13:  0.07%: dial.net.mx
  13:  1.81%: proxad.net
  12:  2.07%: lohjanpuhelin.fi
  12:  0.16%: prodigy.net.mx
  12:  2.16%: club-internet.fr
  11:  0.06%: link.net
  11:  0.03%: cantv.net
  11:  0.19%: pcnet.ro
  10:  0.13%: prtc.net
  10:  0.63%: ttd.es
 502: 44.02%: [not listed: 188 organisations]
(Go To: Top: General Summary: Monthly Report: Daily Summary: Hourly Summary: Domain Report: Organisation Report: Status Code Report: File Size Report: File Type Report: Directory Report: Request Report)
This report lists the HTTP status codes of all requests.
Listing status codes, sorted numerically.
reqs: status code
----: -----------
1148: 200 OK
(Go To: Top: General Summary: Monthly Report: Daily Summary: Hourly Summary: Domain Report: Organisation Report: Status Code Report: File Size Report: File Type Report: Directory Report: Request Report)
This report lists the sizes of files.

       size: reqs: %bytes:
-----------: ----: ------:
          0:  110:       :
   1b-  10b:    6:       :
  11b- 100b:   13:       :
 101b-  1kb:   18:       :
  1kb- 10kb:   22:       :
 10kb-100kb:  573:  2.43%:
100kb-  1Mb:  232:  3.58%:
  1Mb- 10Mb:  140: 43.38%:
 10Mb-100Mb:   34: 50.60%:
(Go To: Top: General Summary: Monthly Report: Daily Summary: Hourly Summary: Domain Report: Organisation Report: Status Code Report: File Size Report: File Type Report: Directory Report: Request Report)
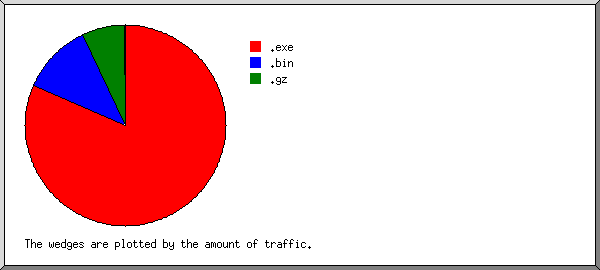
This report lists the extensions of requested files.

Listing extensions with at least 0.1% of the traffic, sorted by the amount of traffic.
 Gbytes: %bytes: reqs:  %reqs: extension
-------: ------: ----: ------: ---------
  1.229: 83.00%: 1013: 88.24%: .exe  [Executables]
  0.192: 13.01%:   34:  2.96%: .gz   [Gzip compressed files]
  0.192: 12.99%:   22:  1.92%:   .tar.gz [Compressed archives]
  0.049:  3.31%:   15:  1.31%: .xpi
  0.004:  0.32%:    1:  0.09%: .hqx  [Macintosh BinHex files]
  0.003:  0.21%:    4:  0.35%: .bin
  0.002:  0.14%:   81:  7.06%: [not listed: 11 extensions]
(Go To: Top: General Summary: Monthly Report: Daily Summary: Hourly Summary: Domain Report: Organisation Report: Status Code Report: File Size Report: File Type Report: Directory Report: Request Report)
This report lists the directories from which files were requested. (The figures for each directory include all of its subdirectories.)

Listing directories with at least 0.01% of the traffic, sorted by the amount of traffic.
 Gbytes: %bytes: reqs:  %reqs: pages: %pages: directory
-------: ------: ----: ------: -----: ------: ---------
  1.415: 95.59%: 1091: 95.03%:     0:       : /pub/
  0.064:  4.33%:   12:  1.05%:     0:       : /communicator/
  0.001:  0.08%:   20:  1.74%:     0:       : [no directory]
  0.000:       :   25:  2.18%:     0:       : [not listed: 3 directories]
(Go To: Top: General Summary: Monthly Report: Daily Summary: Hourly Summary: Domain Report: Organisation Report: Status Code Report: File Size Report: File Type Report: Directory Report: Request Report)
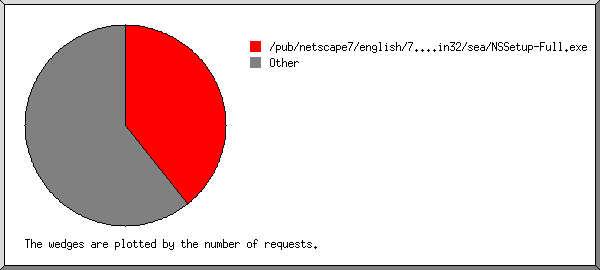
This report lists the files on the site.

Listing files with at least 20 requests, sorted by the number of requests.
 Mbytes: %bytes: reqs:  %reqs: file
-------: ------: ----: ------: ----
 36.835:  2.43%:  545: 47.47%: /pub/netscape7/english/7.0/windows/win32/NSSetup.exe
171.669: 11.32%:   61:  5.31%: /pub/netscape7/portuguese_br/7.0/windows/win32/sea/NSSetupB.exe
  4.183:  0.28%:   49:  4.27%: /pub/netscape7/spanish/7.0/windows/win32/NSSetup.exe
240.350: 15.85%:   40:  3.48%: /pub/netscape7/french/7.0/windows/win32/sea/NSSetupB.exe
  2.518:  0.17%:   32:  2.79%: /pub/netscape7/french/7.01/windows/win32/NSSetup.exe
  2.502:  0.17%:   29:  2.53%: /pub/netscape7/english_uk/7.0/windows/win32/NSSetup.exe
  2.463:  0.16%:   28:  2.44%: /pub/netscape7/german/7.0/windows/win32/NSSetup.exe
  2.355:  0.16%:   26:  2.26%: /pub/netscape7/german/7.01/windows/win32/NSSetup.exe
  2.202:  0.15%:   26:  2.26%: /pub/netscape7/french/7.0/windows/win32/NSSetup.exe
288.312: 19.01%:   20:  1.74%: /pub/netscape7/english/7.02/windows/win32/sea/NSSetupB.exe
762.935: 50.31%:  292: 25.44%: [not listed: 104 files]
(Go To: Top: General Summary: Monthly Report: Daily Summary: Hourly Summary: Domain Report: Organisation Report: Status Code Report: File Size Report: File Type Report: Directory Report: Request Report)